

")
A 2000-year temperature reconstruction on the East Antarctic plateau from argon–nitrogen and water stable isotopes in the Aurora Basin North ice core
The temperature of the Earth is one of the most important climate parameters. Proxy records of past climate changes, in particular temperature, represent a fundamental tool for exploring internal climate processes and natural climate forcings. Despite the excellent information provided by ice core records in Antarctica, the temperature variability of the past 2000 years is difficult to evaluate from the low-accumulation sites in the Antarctic continent interior. Here we present the results from the Aurora Basin North (ABN) ice core (71∘ S, 111∘ E, 2690 m a.s.l.) in the lower part of the East Antarctic plateau, where accumulation is substantially higher than other ice core drilling sites on the plateau, and provide unprecedented insight into East Antarctic past temperature variability. We reconstructed the temperature of the last 2000 years using two independent methods: the widely used water stable isotopes (δ18O) and by inverse modelling of borehole temperature and past temperature gradients estimated from the inert gas stable isotopes (δ40Ar and δ15N). This second reconstruction is based on three independent measurement types: borehole temperature, firn thickness, and firn temperature gradient. The δ18O temperature reconstruction supports stable temperature conditions within 1 ∘C over the past 2000 years, in agreement with other ice core δ18O records in the region. However, the gas and borehole temperature reconstruction suggests that surface conditions 2 ∘C cooler than average prevailed in the 1000–1400 CE period and supports a 20th century warming of 1 ∘C. A precipitation hiatus during cold periods could explain why water isotope temperature reconstruction underestimates the temperature changes. Both reconstructions arguably record climate in their own way, with a focus on atmospheric and hydrologic cycles for water isotopes, as opposed to surface temperature for gas isotopes and boreholes. This study demonstrates the importance of using a variety of sources for comprehensive paleoclimate reconstructions.
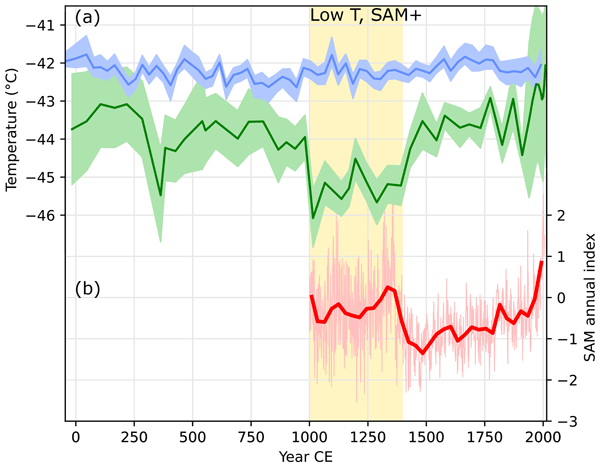
Figure : δ18O temperature and 15Nexcess temperature reconstructions (this study). Error shading is the same as in Fig. 9. (b) Southern Annual Mode (SAM) annual reconstruction (Dätwyler et al., 2018). The annual resolution of the SAM index is represented by thin lines, and thick lines are the 30-year average for both δ18O temperature and SAM; 15N-excess temperature has a resolution of about 45 years. Yellow shading highlights the 1000–1400 CE period during which the 15N-excess temperature is significantly colder, in phase with a positive SAM index.
Reference: Servettaz, A. P. M., Orsi, A. J., Curran, M. A. J., Moy, A. D., Landais, A., McConnell, J. R., Popp, T. J., Le Meur, E., Faïn, X., and Chappellaz, J., 2023. A 2000-year temperature reconstruction on the East Antarctic plateau from argon–nitrogen and water stable isotopes in the Aurora Basin North ice core. Clim. Past, 19, 1125–1152, https://doi.org/10.5194/cp-19-1125-2023
The ST22 chronology for the Skytrain Ice Rise ice core – Part 2: An age model to the last interglacial and disturbed deep stratigraphy
We present an age model for the 651 m deep ice core from Skytrain Ice Rise, situated inland of the Ronne Ice Shelf, Antarctica. The top 2000 years have previously been dated using age markers interpolated through annual layer counting. Below this, we align the Skytrain core to the AICC2012 age model using tie points in the ice and air phase, and we apply the Paleochrono program to obtain the best fit to the tie points and glaciological constraints. In the gas phase, ties are made using methane and, in critical sections, δ18Oair; in the ice phase ties are through 10Be across the Laschamps event and through ice chemistry related to long-range dust transport and deposition. This strategy provides a good outcome to about 108 ka (∼ 605 m). Beyond that there are signs of flow disturbance, with a section of ice probably repeated. Nonetheless values of CH4 and δ18Oair confirm that part of the last interglacial (LIG), from about 117–126 ka (617–627 m), is present and in chronological order. Below this there are clear signs of stratigraphic disturbance, with rapid oscillation of values in both the ice and gas phase at the base of the LIG section, below 628 m. Based on methane values, the warmest part of the LIG and the coldest part of the penultimate glacial are missing from our record. Ice below 631 m appears to be of age > 150 ka.
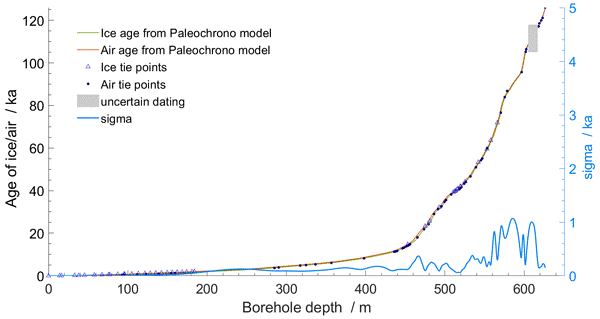
Figure : Age against depth for the Skytrain Ice Rise ice core. In the top panel, ice and air age are shown, along with the tie points we applied. The turquoise line shows the uncertainty on the ice age derived from Paleochrono, using the right hand y axis. The section with unreliable ages (605–617 m) is greyed out, and the uncertainties around this section are probably underestimated.
Reference: Mulvaney, R., Wolff, E. W., Grieman, M. M., Hoffmann, H. H., Humby, J. D., Nehrbass-Ahles, C., Rhodes, R. H., Rowell, I. F., Parrenin, F., Schmidely, L., Fischer, H., Stocker, T. F., Christl, M., Muscheler, R., Landais, A., and Prié, F., 2023. The ST22 chronology for the Skytrain Ice Rise ice core – Part 2: An age model to the last interglacial and disturbed deep stratigraphy. Clim. Past, 19, 851–864, https://doi.org/10.5194/cp-19-851-2023.